Desa Mendik


Desa Mendik
Kecamatan Long Kali, Kabupaten PASER

Jumlah dan Persentase Penduduk Menurut Kelompok Rentang Umur di Desa Mendik, 2026
| Kode | Kelompok | Jumlah | Laki-laki | Perempuan | |||
|---|---|---|---|---|---|---|---|
| n | % | n | % | n | % | ||
Diperbarui pada : 01 Oktober 2025
Aparatur Desa


Desa Mendik
Kecamatan Long Kali, Kabupaten PASER
1501
Laki-laki
1342
Perempuan
2843
TOTAL
Laki-laki : 1501 ORANG
Perempuan : 1342 ORANG
TOTAL : 2843 ORANG

88 Kali dibuka
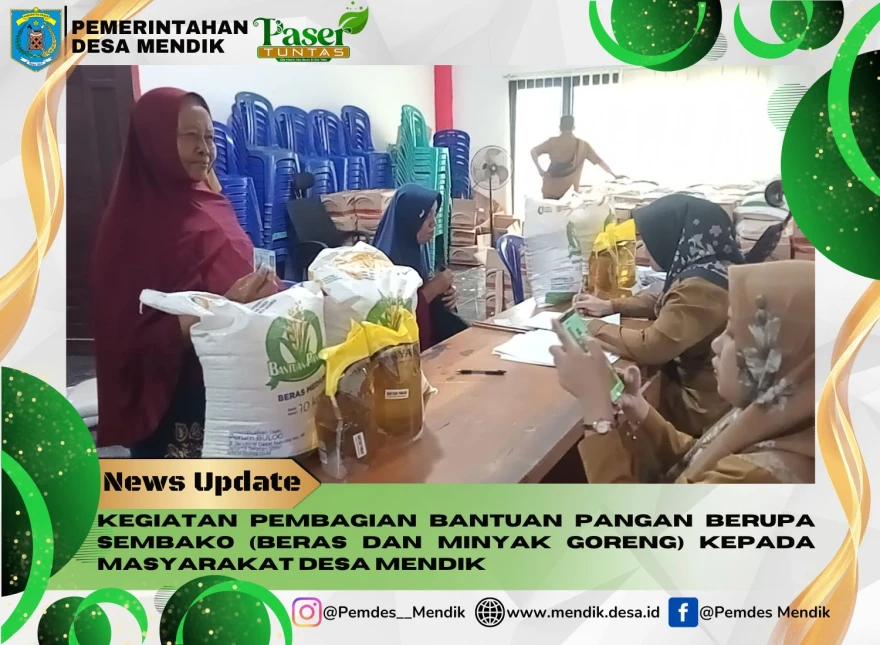
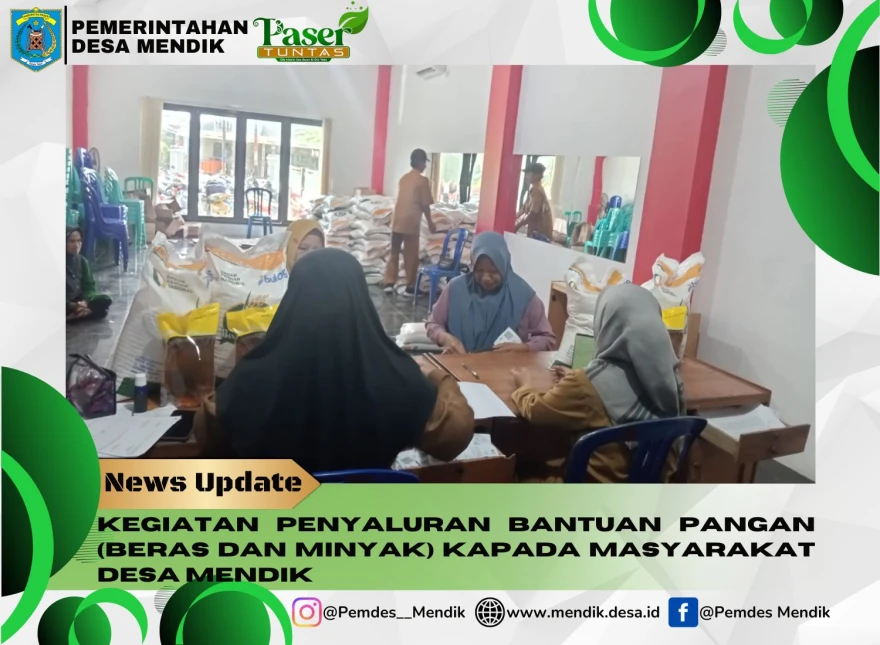
PENYALURAN BANTUAN PANGAN BERUPA BERAS DAN MINYAK GORENG DI DESA MENDIK TAHUN 2026
270 Kali dibuka
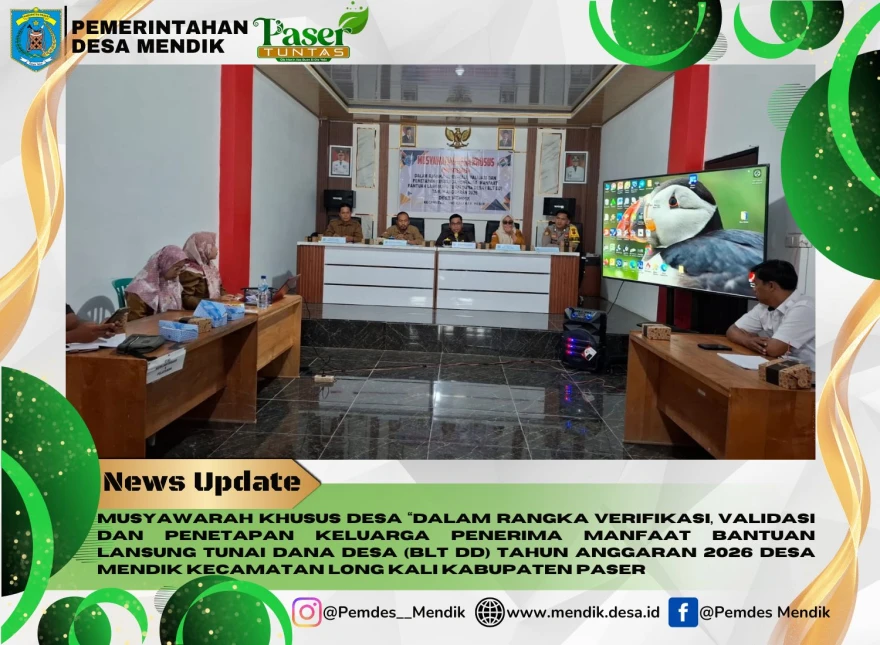
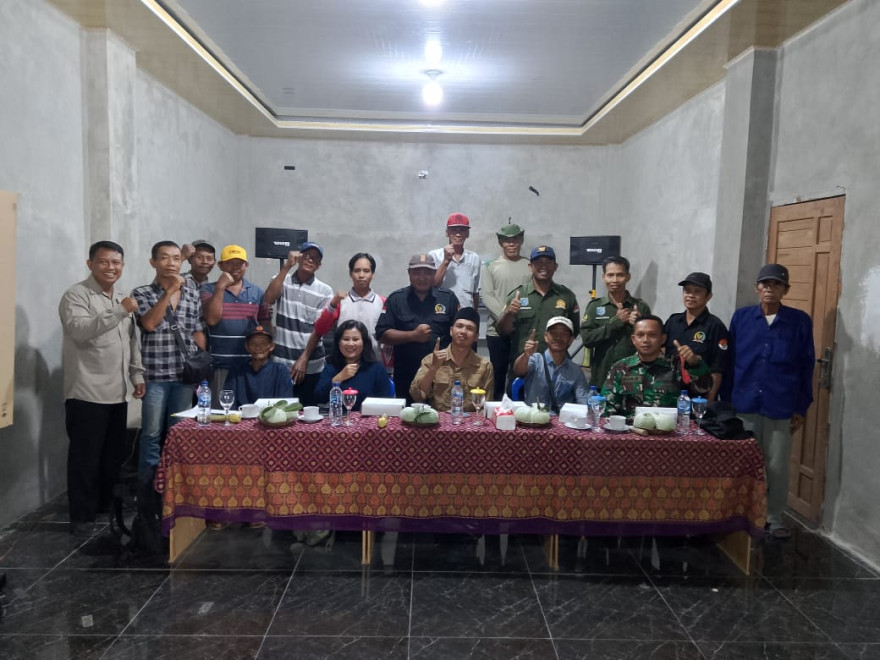
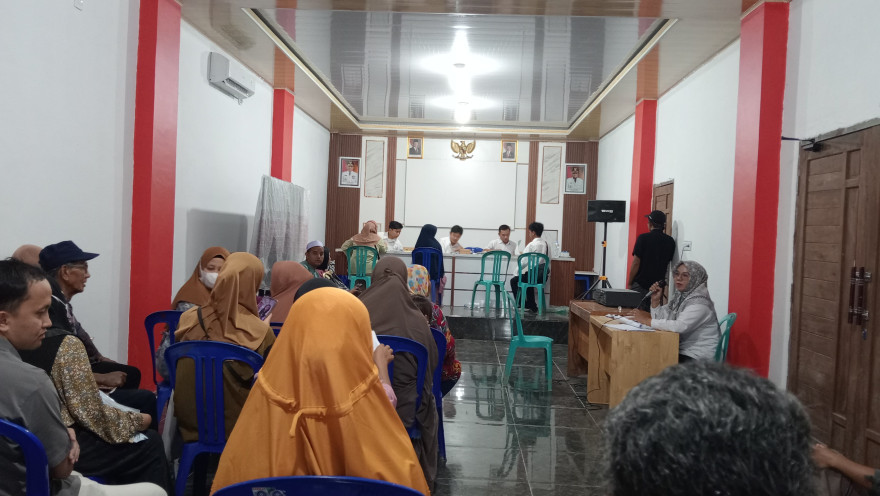
MUSYAWARAH DESA KHUSUS (MUSDESUS) DALAM RANGKA VERIFIKASI, VALIDASI DAN PENETAPAN KELUARGA PENERIMA MANFAAT BANTUAN LANSUNG TUNAI DANA DESA (BLT DD) TAHUN ANGGARAN 2026
404 Kali dibuka
PEMERINTAH DESA MENDIK SALURKAN BANTUAN PANGAN BERUPA BERAS DAN MINYAK KEPADA MASYARAKAT
382 Kali dibuka
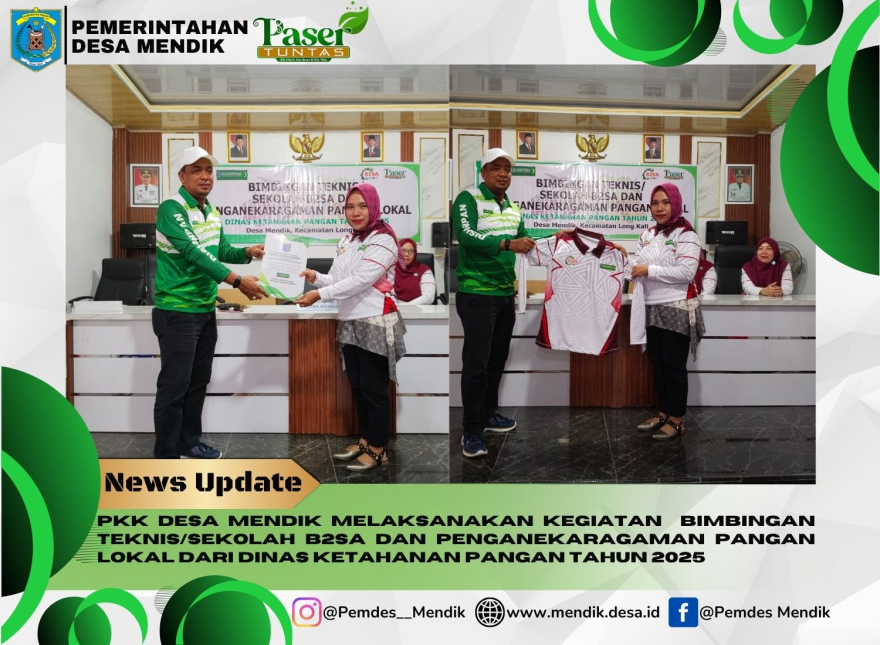
TP PKK DESA MENDIK MELAKSANAKAN KEGIATAN BIMBINGAN TEKNIS ATAU SEKOLAH B2SA DAN PENGANEKARAGAMAN PANGAN
416 Kali dibuka
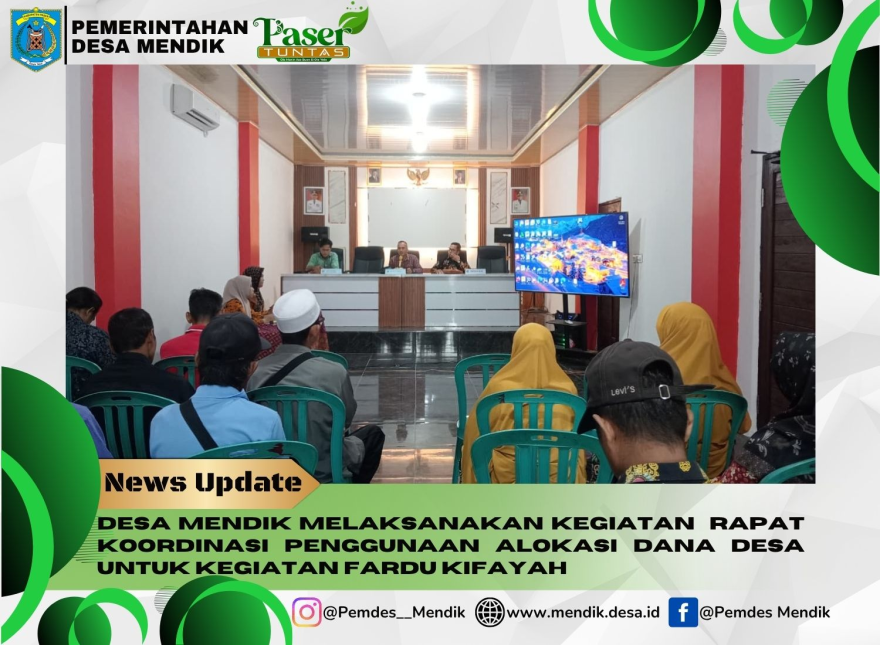
RAPAT KOORDINASI PENGGUNAAN ALOKASI DANA DESA UNTUK KEGIATAN FARDU KIFAYAH DESA MENDIK
661 Kali dibuka
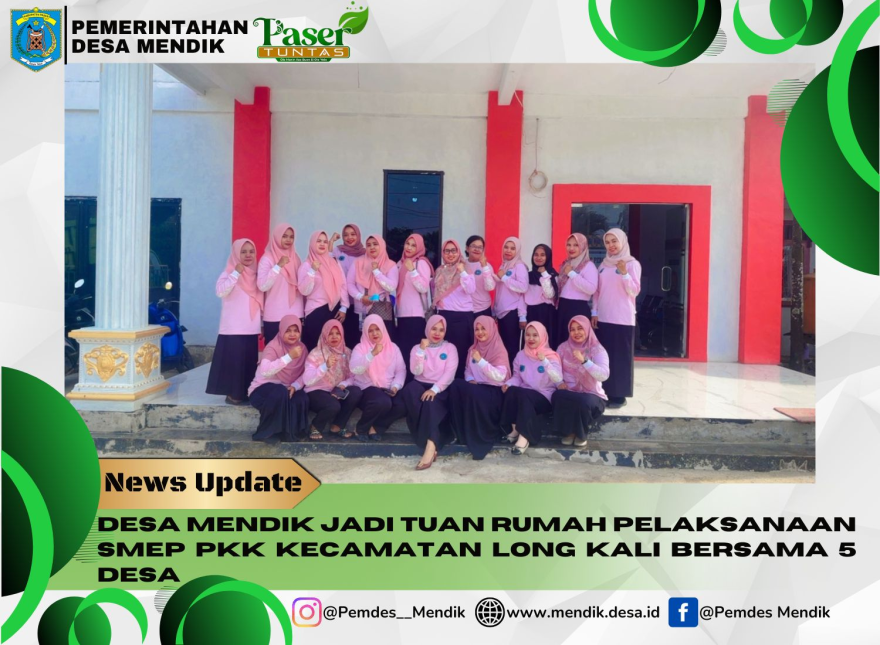
KEGIATAN SMEP PKK KECAMATAN LONG KALI DI DESA MENDIK
387 Kali dibuka
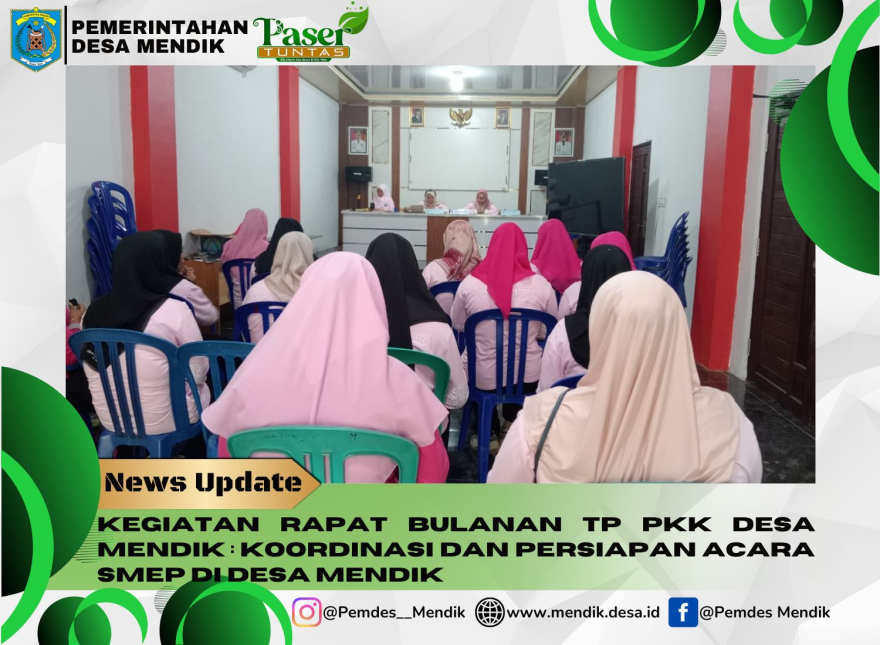
RAPAT BULANAN PKK DESA MENDIK MEMBAHAS PERSIAPAN SMEP KECAMATAN LONG KALI
1.646 Kali dibuka
Pembentukan Brigade Alsintan Desa Mendik

991 Kali dibuka
PELATIHAN DIGITAL MARKETING PRODUK UMKM
973 Kali dibuka
Pelatihan Transformasi Digital Untuk Aparatur Desa/KampungTahun Anggran 2024

932 Kali dibuka
Fogging atau pengasapan nyamuk Demam Berdarah Dengue (DBD)

922 Kali dibuka
PHOTOGRAPHY DAN VIDIOGRAPHY DASAR UNTUK UMKM

827 Kali dibuka
Pelatihan Pengelolaan Website Desa
740 Kali dibuka
PEMBAGIAN SERTIFIKAT PROGRAM PTSL TAHUN 2024 TAHAP III DI DESA MENDIK


Mohon maaf, Untuk sementara komentar belum tersedia


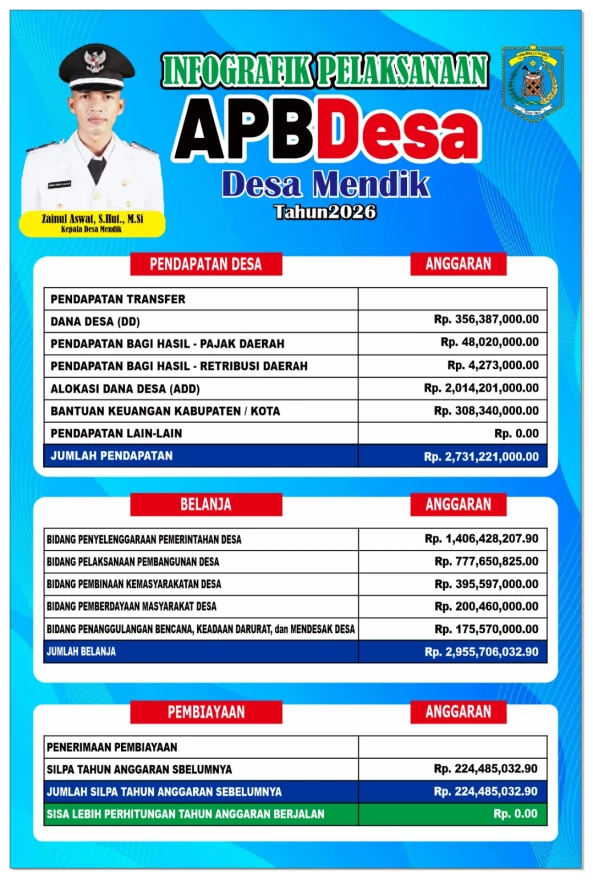
Transparansi Anggaran
APBD 2025 Pelaksanaan
APBD 2025 Pendapatan
APBD 2025 Pembelanjaan
Pemerintah Desa Mendik
Jl. Mangkuruku RT 014, Kecamatan Long Kali, Kabupaten PASER
desamendik49@gmail.com
OpenSID 2605.0.1-premium - Wae Taka v1.0